
If you’re on the hunt for recent B2B marketing statistics, you’ve come to the right place.
And kudos for seeking out fresh stats, by the way.
Because high-quality, timely data is the cornerstone of B2B content that’s worth reading.
From trending reports to first-hand case studies and beyond, relevant statistics are crucial for backing up your claims and coming up with new talking points.
The problem, though? Digging for B2B marketing statistics can be a drag.

Trust me – I totally get it.
The number of marketing blogs out there is staggering. Finding the right statistic for any given article can feel like looking for a needle in a haystack.
Even worse, many blogs tend to republish and recycle statistics over and over. This leads to the phenomenon of writers rehashing the same outdated statistics to the point where it’s impossible to find a legitimate source.
Listen: conducting research shouldn’t be a headache.
Instead of digging through a bunch of statistics round-up posts, writers should have their own go-to resources for finding data that’s current and trustworthy.
And hey, that’s exactly why I put together this list.
Where to find up-to-date B2B marketing statistics for 2020
Below is a breakdown of some of the best places to find new reports, case studies and other research to cite in your marketing-related content.
If nothing else, these sites and sources can provide inspiration and ideas for future B2B blog posts.
1. Marketing Charts
Marketing Charts is home to thousands of up-to-date reports related to B2B marketing.
Although the site posts a few reports per day, the Marketing Charts notes that they’re picky about what they’re willing to publish.
Translation? The folks are Marketing Charts pride themselves on posting high-quality, fluff-free research.
The site’s data covers everything from marketing channels to advertising trends and beyond. Marketing Charts’ reports are summarized in plain English, often brimming with statistics.
Oh, and don’t forget that colorful graphics and charts that accompany each of their reports.
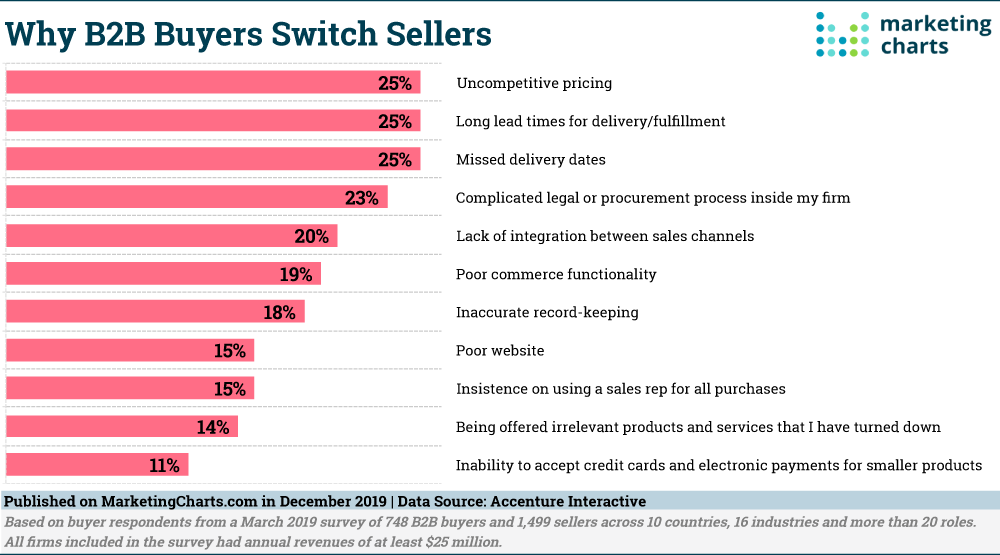
These are perfect for embedding into your next B2B blog post, allowing you to score some style points and attribute your stats at the same time.
2. MarketingSherpa
In their own words, MarketingSherpa’s mission is to “give marketers of the world the stats, inspirations and instructions to improve their results.”
The site publishes a variety of B2B and B2C articles on a weekly basis. You can narrow down your search to zero in on their B2B statistics than are less than a year old.
Not unlike Marketing Charts, MarketingSherpa often couples their reports and case studies with blog-ready graphics.

3. Econsultancy
Remember what I said earlier about the overwhelming amount of marketing blogs out there?
Econsultancy’s own blog actually cuts through the noise to hone in new data that marketers should know about.
Each week the site posts a round-up (“The best digital marketing stats we’ve seen this week“) which highlights new studies and research from around the blogosphere. This bite-sized summary of stats is perfect for busy writers.
Oh, and these posts are also coupled with embed-friendly images for your blog posts. Seeing a trend here?

4. eMarketer
eMarketer is yet another repository of B2B marketing statistics that often get cited like crazy.
Although a bulk of the site’s content sits behind a paywall, you can access key stats in the executive summary of any given report.
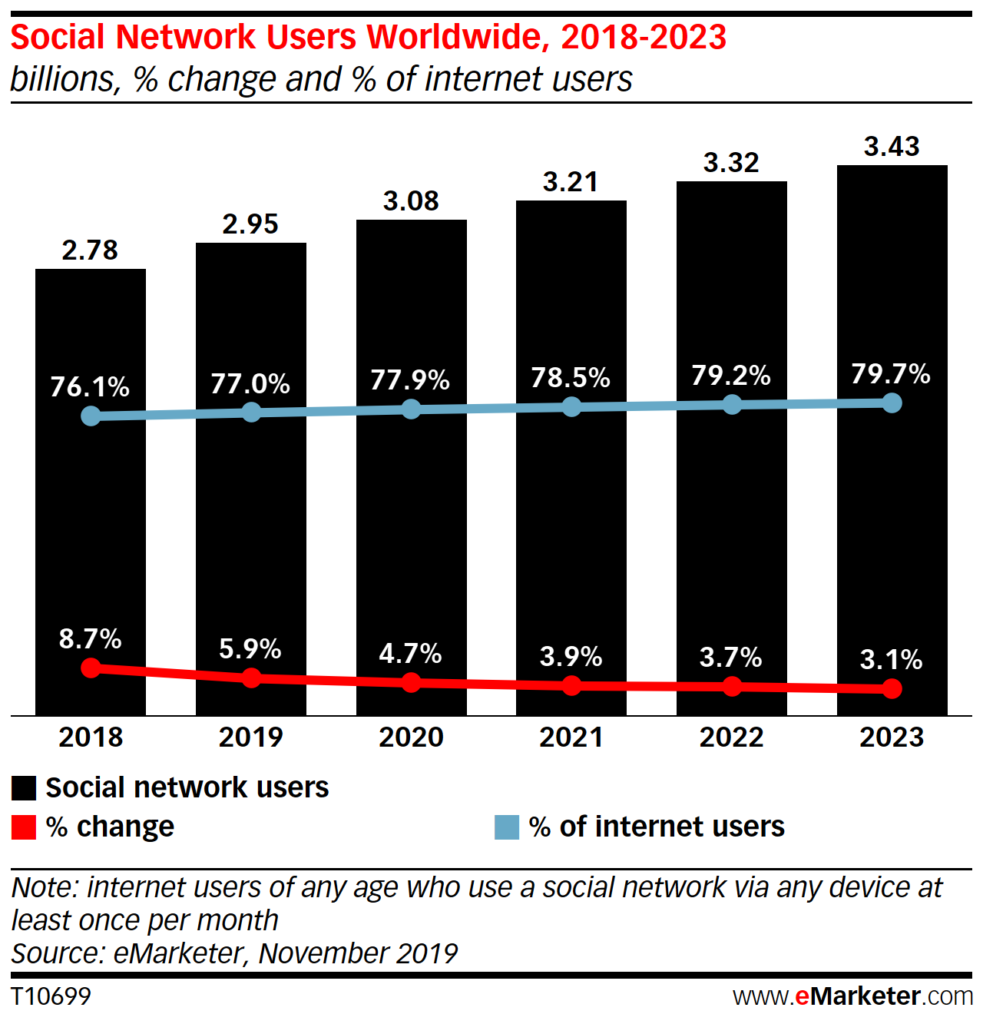
Likewise, you can access sMarketer’s charts which accompany most of their studies.
5. B2Bmarketing.net
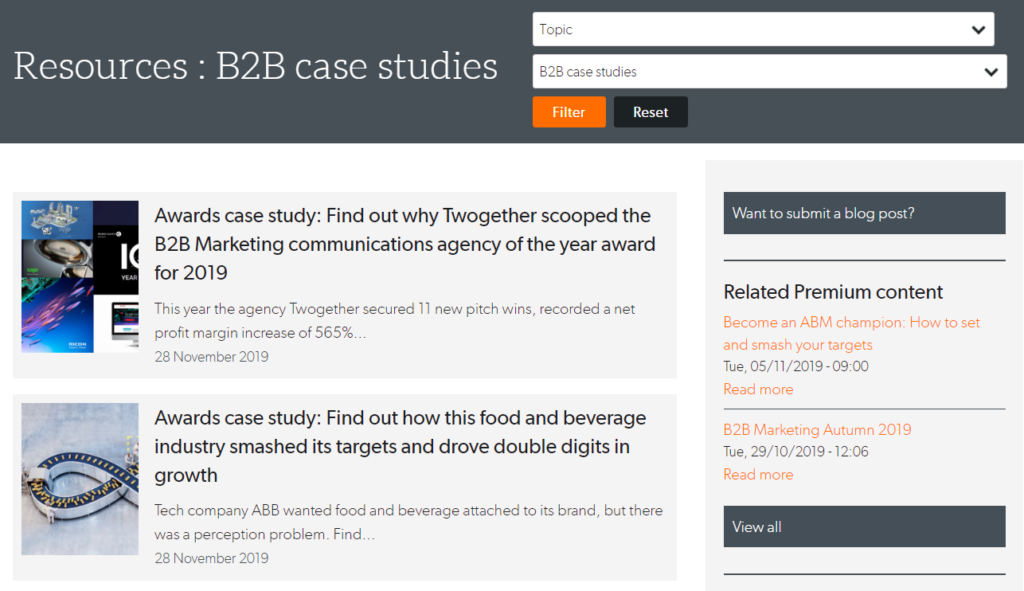
B2Bmarketing.net boasts a variety of B2B case studies from brands, typically highlighting the positive results or ROI of a marketing tactic.
The site’s filter tool is useful if you’re looking for B2B marketing statistics related to a specific channel such as social media or email.
Some of these stats might seem niche but hey, that might be what you or your client are looking for.
5. LinkedIn
The go-to social network for B2B, LinkedIn seems to be rolling out more and more reports and case studies which is good news for writers looking for new stats.
For example, LinkedIn’s official blog and Business Solutions are home to in-depth resources such as the 2019 State of Sales Report. Be on the lookout for more in the near future.

6. Statista
Statista is a massive repository of business stats, plain and simple.
Note that the site offers limited access to statistics due to its paywall.
That said, you can uncover some specialized stats and accompanying charts with a bit of digging (see below).
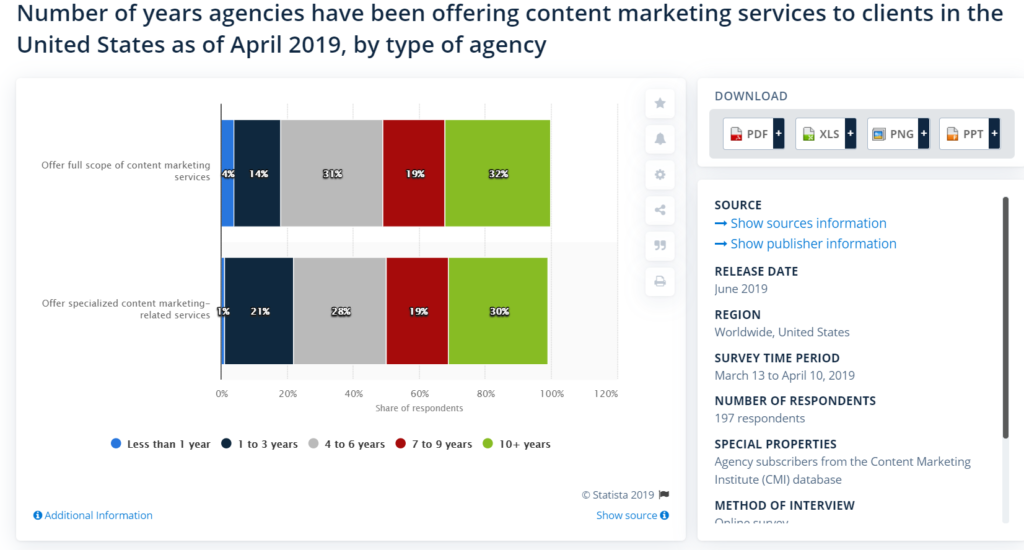
Statista also provides a glance of each stat’s source, sample size and survey period. This information is helpful for providing additional context to your chosen statistic within your post.
7. Annual Research Reports and Round-Ups
There tons of brands and organizations that publish annual research reports based on customer data.
Here’s a snapshot of some popular reports (mostly from 2019) which you can expect to update sometime during 2020. Either way, the B2B marketing stats found in these reports are totally fair game for content published within the next year.
- The CMO Survey August 2019 (marketing leadership, published every February and August)
- Sprout Social Index 2019 (social media, published annually)
- Search Engine Journal’s Search Trends 2020 (SEO, published annually)
- Litmus State of Email Report 2019 (email marketing trends, published annually)
- Salesforce State of Marketing 2018 (sales and marketing)
- Gartner Research Reports for 2019/2020 (various marketing trends)
- GlobalWebIndex’s Reports for 2019/2020 (various marketing trends)
- UpLead’s 100+ Sales Statistics for 2020 (sales)
8. Google
And of course, Google is your friend when it comes to finding B2B statistics and recent reports from fellow marketers.
Simply search “2020” alongside relevant terms such as “marketing case study,” “marketing report” or “marketing survey” and see what comes up.

Of course, make sure that you’re actually look at 2020 statistics from trusted sources. If you’re not sure, always use content tools such as MozBar to double-check the domain authority of a site
How to make the most of your B2B marketing statistics
You’ve got your data.
Now what?
To wrap things up, here are some quick points to consider before you stick any new statistics into your next post.
Be wary of outdated stats
As noted earlier, many marketing statistics are repeated and recycled via statistic round-up posts (think: “11 Content Marketing Statistics for 2020”).
Sometimes you’ll run into a situation where a statistic is years old but gets passed off as something new.
Heck, this actually happened to me recently while doing research for a client.
There is no “right” answer to how recent your statistics need to be.
That said, most of my clients’ rule of thumb is to try to cite sources that are no more than two years old.
Why? Because the marketing space movies quick.
Here’s an example. This post from 2015 cites Instagram as having 300 million active users. Fast forward to 2018 when the platform passed the one billion user mark.
Simply put, a lot can change in just a year (let alone three). Outdated data might make your talking points moot or your content downright inaccurate.
But if there’s an older statistic that you’re absolutely itching to use, you still have options.
For example, sometimes I’ll refer to an older stat as a “classic” or “oft-cited statistic” if it’s a popular or pretty much considered conventional wisdom. When in doubt, use your best judgment.
Cite primary sources
This is something to consider if you’re looking to cite something from at a statistic round-up post.
Let’s use Hubspot as an example.
Although this particular list is titled as being for 2019, it contains some older stats as well.
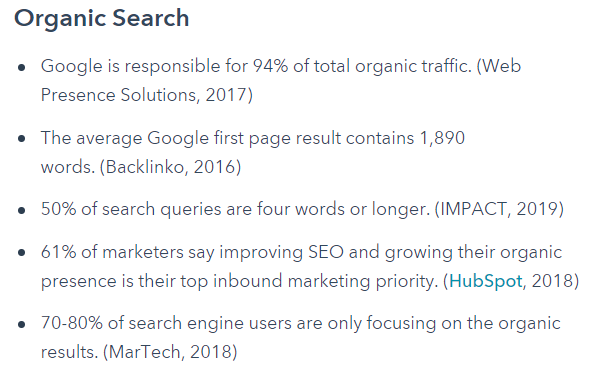
And hey, that’s totally fine. Many statistic round-up posts are targeting time-sensitive keywords and year-old stats certainly still have value.
That said, let’s say you were going to cite the state above that “50% of search queries are four words or longer.” In this case, you’d want to link out to IMPACT’s data (if you can find it) as the primary source.
See how that works? By linking solely to secondary sources, you run the risk of running your readers around in a circle as they can’t actually find the data they’re looking for.
Interpret the stat correctly
This might seem like a no-brainer but it’s worth noting.
When you’re citing a statistic, double-check that what you’re citing actually makes sense.
For example, there’s a huge difference between “50% of marketers” versus “50% of consumers” being surveyed.
Additionally, parsing numbers and percentages can be confusing. Here’s an example of a fuzzy statistic I had to make sense of.
Sure, we all want to write data-driven content.
However, double-check that your stats are reinforcing your points rather than muddying the waters.
Where are you getting your marketing data?
If you’re writing about marketing, statistics are your bread and butter.
As highlighted by much of my own top-performing posts, high-ranking B2B marketing content relies on up-to-date data.
Because timely statistics not only make your content immediately relevant but also can clue you in on new trends and content ideas.
Bookmark these sites. Follow ’em on Twitter. Sign up for their newsletters.
Hopefully, this list clued you in on some new resources to check out for your next post.
And if there are any additional resources for B2B marketing statistics that I missed, be sure to let me know on Twitter (@brentwrites).
This post was last updated on 1/13/2020.
Thank you so much for these resources! They are great.